Read about how an online survey was used to gather information for the review.

4.1 Overview

An online engagement platform was used to host information about the current status of digital technology and skills in undergraduate and preregistration health and care education review and how people could contribute to the project.

The survey aimed to collect initial insight into the current use and teaching of digital technologies from key stakeholders who have specific knowledge and experience in this area.

The survey was targeted to the following stakeholders in particular.

  • Students.
  • Members of staff at Higher Education Institutions.
  • Practice education facilitators.
  • Members of staff responsible for educational strategy, policy and design (including staff of regulatory and professional bodies).

The survey opened on Monday 12 December 2022 and closed on Wednesday 8 February 2023.

4.2 Survey demographics

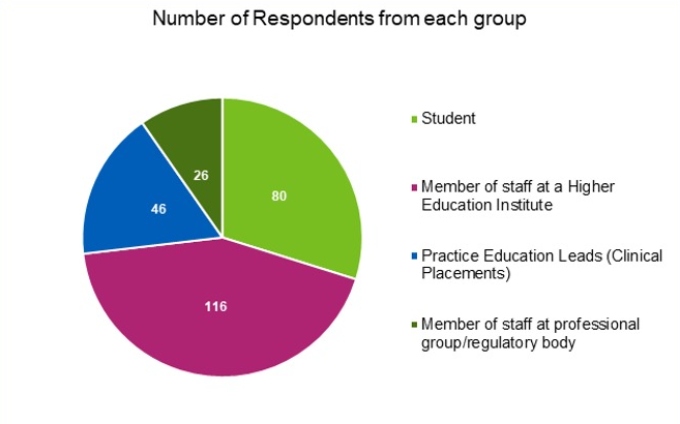
Overview: 268 participants completed the survey, with the highest response rate being from members of staff at Higher Education Institutions (43%).

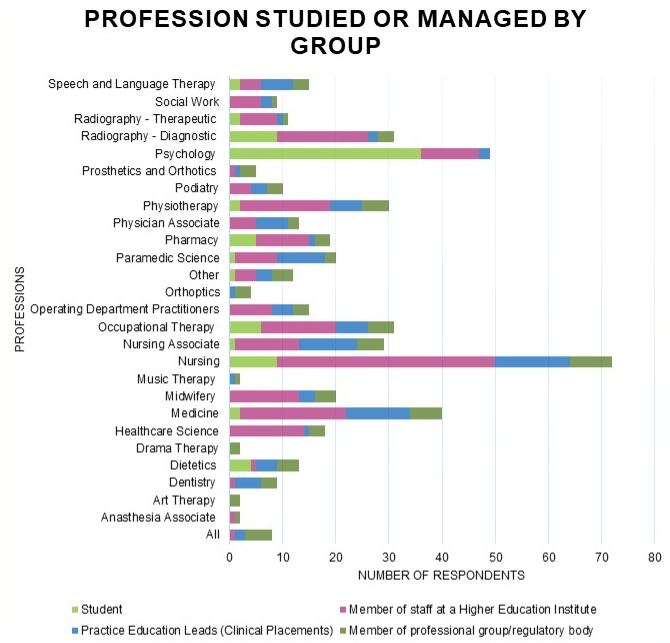
Most of these responses have been from individuals in the Nursing profession with 53 responses (20%) followed closely by those from the Psychology profession with 38 responses (14%) and Medicine with 29 responses (11%). However, for the following professions, there had been less than 5 responses: Anaesthesia Associate, Art Therapy, Drama Therapy, Music Therapy and Orthoptics. In terms of response rates by region, the South East had the highest response rate with 51 responses (19%) followed by the London region with 41 (15%) responses. East of England had the least representation with the region having 9 responses (3%).

A pie chart showing the number of respondents from each demographic group.
80 respondents were students.
116 respondents were members of staff at a Higher Education Institute.
46 respondents were Practice Education Leads (Clinical Placements).
26 respondents were members of staff at professional group/regulatory body.
Figure 1: Chart showing number of respondents from each group

The graph below displays the overall number of participants who were associated with professions, whilst also stating their role within the survey. All participants except students were offered the option to select “All” as an option. In addition, students were only able to select 1 profession as an answer whereas the other participants were able to select multiple professions.

Please note that for those who selected “other”, their stated profession was:

  • Business Management
  • Advanced Clinical Practitioner
  • Educational Practitioner
  • General Practitioner
  • Information Governance
A bar chart showing the profession studied or managed by group.
Profession studied or managed group – number of respondents 
Profession: Anaesthesia Associate
Student 0
Member of staff at a Higher Education Institute 1
Practice Education Leads (Clinical Placements) 0
Member of professional group/regulatory body 1

Profession: Art Therapy
Student 0
Member of staff at a Higher Education Institute 0
Practice Education Leads (Clinical Placements) 0
Member of professional group/regulatory body 2	
Profession: Dentistry
Student 0
Member of staff at a Higher Education Institute 1
Practice Education Leads (Clinical Placements) 5
Member of professional group/regulatory body 3
Profession: Dietetics
Student 4
Member of staff at a Higher Education Institute 1
Practice Education Leads (Clinical Placements) 4
Member of professional group/regulatory body 4
Profession: Drama Therapy
Student 0
Member of staff at a Higher Education Institute 0
Practice Education Leads (Clinical Placements) 0
Member of professional group/regulatory body 2
Profession: Healthcare Science
Student 0
Member of staff at a Higher Education Institute 14
Practice Education Leads (Clinical Placements) 1
Member of professional group/regulatory body 3
Profession: Medicine
Student 2
Member of staff at a Higher Education Institute 20
Practice Education Leads (Clinical Placements) 12
Member of professional group/regulatory body 6
Profession: Midwifery
Student 0
Member of staff at a Higher Education Institute 13
Practice Education Leads (Clinical Placements) 3
Member of professional group/regulatory body	4			
Profession: Music Therapy
Student 0
Member of staff at a Higher Education Institute 0
Practice Education Leads (Clinical Placements) 1
Member of professional group/regulatory body	1
Profession: Nursing
Student 9
Member of staff at a Higher Education Institute 41
Practice Education Leads (Clinical Placements) 14
Member of professional group/regulatory body	8	
Profession: Nursing Associate
Student 1
Member of staff at a Higher Education Institute 12
Practice Education Leads (Clinical Placements) 11
Member of professional group/regulatory body	5			
Profession: Occupational Therapy
Student 6
Member of staff at a Higher Education Institute 14
Practice Education Leads (Clinical Placements) 6
Member of professional group/regulatory body	5			
Profession: Operating Department Practitioners
Student 0
Member of staff at a Higher Education Institute 8
Practice Education Leads (Clinical Placements) 4
Member of professional group/regulatory body	3			
Profession: Other
Student 1
Member of staff at a Higher Education Institute 4
Practice Education Leads (Clinical Placements) 3
Member of professional group/regulatory body 4
Profession: Orthoptics
Student 0
Member of staff at a Higher Education Institute 0
Practice Education Leads (Clinical Placements) 1
Member of professional group/regulatory body 3
Profession: Paramedic Science
Student 1
Member of staff at a Higher Education Institute 8
Practice Education Leads (Clinical Placements) 9
Member of professional group/regulatory body 2
Profession: Pharmacy
Student 5
Member of staff at a Higher Education Institute 10
Practice Education Leads (Clinical Placements) 1
Member of professional group/regulatory body 3
Profession: Physician Associate
Student 0
Member of staff at a Higher Education Institute 5
Practice Education Leads (Clinical Placements) 6
Member of professional group/regulatory body 2
Profession: Physiotherapy
Student 2
Member of staff at a Higher Education Institute 17
Practice Education Leads (Clinical Placements) 6
Member of professional group/regulatory body 5
Profession: Podiatry
Student 0
Member of staff at a Higher Education Institute 4
Practice Education Leads (Clinical Placements) 3
Member of professional group/regulatory body 3
Profession: Prosthetics and Orthotics
Student 0
Member of staff at a Higher Education Institute 1
Practice Education Leads (Clinical Placements) 1
Member of professional group/regulatory body	3			
Profession: Psychology
Student 36
Member of staff at a Higher Education Institute 11
Practice Education Leads (Clinical Placements) 2
Member of professional group/regulatory body 0
Profession: Radiography - Diagnostic
Student 9
Member of staff at a Higher Education Institute 17
Practice Education Leads (Clinical Placements) 2
Member of professional group/regulatory body 3
Profession: Radiography - Therapeutic
Student 2
Member of staff at a Higher Education Institute 7
Practice Education Leads (Clinical Placements) 1
Member of professional group/regulatory body 1
Profession: Social Work
Student 0
Member of staff at a Higher Education Institute 6
Practice Education Leads (Clinical Placements) 2
Member of professional group/regulatory body 1
Profession: Speech and Language Therapy
Student 2
Member of staff at a Higher Education Institute 4
Practice Education Leads (Clinical Placements) 6
Member of professional group/regulatory body 3
Figure 2: The response rates from each associated profession
A bar chart showing the response rate for each region by group.
Response rate for each region by group				
				
Region: Southeast
Student 16
Member of staff at a Higher Education Institute 29
Practice Education Leads (Clinical Placements) 19
Member of professional group/regulatory body 6
Region: Southwest
Student 8
Member of staff at a Higher Education Institute 12
Practice Education Leads (Clinical Placements) 9
Member of professional group/regulatory body 2
Region: Midlands
Student 4
Member of staff at a Higher Education Institute 16
Practice Education Leads (Clinical Placements) 8
Member of professional group/regulatory body 1
Region: Northeast & Yorkshire
Student 9
Member of staff at a Higher Education Institute 20
Practice Education Leads (Clinical Placements) 7
Member of professional group/regulatory body 1
Region: Northwest
Student 9
Member of staff at a Higher Education Institute 18
Practice Education Leads (Clinical Placements) 0
Member of professional group/regulatory body 3
Region: East of England
Student 2
Member of staff at a Higher Education Institute 7
Practice Education Leads (Clinical Placements) 1
Member of professional group/regulatory body 3
Region: London
Student 33
Member of staff at a Higher Education Institute 15
Practice Education Leads (Clinical Placements) 1
Member of professional group/regulatory body 5
Region: National
Student 0
Member of staff at a Higher Education Institute 0
Practice Education Leads (Clinical Placements) 1
Member of professional group/regulatory body 6
Region: Online/Open University
Student 0
Member of staff at a Higher Education Institute 0
Practice Education Leads (Clinical Placements) 0
Member of professional group/regulatory body 6
Figure 3: The response rates from each region

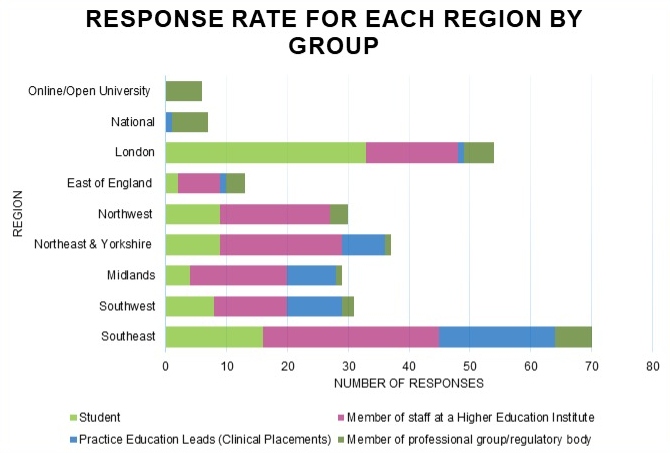
The above graph displays the overall number of participants associated with each region. Within the survey, only the student participants were offered the opportunity to select online/open university as an option. All other groups were given the opportunity to select “National” as an option to encompass online education, such as educators at open universities, and those responsible for national programmes of work in this area. In addition, the staff at high education institutions (HEIs), Practice Education Leads and Professional Group/Regulatory body were offered a “National” option whereas students were not.

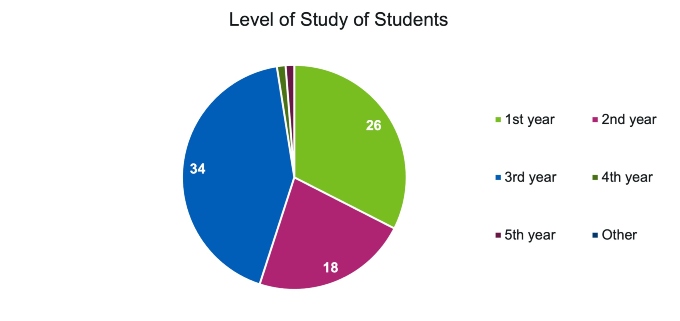
Student demographics

Out of the 80 student responses, 79 respondents were undergraduate preregistration students, and 1 respondent was classed as ‘undergraduate other’. The graph below shows the split of the level of study across the student participants.

Figure 4: The response rates from students broken down into their related year group. Please note, there was only one student participant from 4th year and one from 5th year.

Page last reviewed: 9 May 2023
Next review due: 9 May 2024